Bold statement: Vector graphics are the coolest and cleanest around. They outshine regular raster graphics 7 days a week.
The problem, as I see it, is that most people prefer Photoshop (or Gimp, or Paint) over Illustrator or Inkscape, and so they brush their life away never knowing about the magic of developing vector-based graphics. Today we’re going to talk about drawing in SVG!
And yes, I know I said it’s complicated, but it really isn’t. Let’s begin.
What is SVG?
If you’re not familiar with XML, that’s Ok. All you need to know for the purposes of this article is that XML is a versatile markup language defining data structure with tags and attributes. It is used for both storing information and exchanging it between applications and systems. XML files are text-based and don’t rely on specific software or hardware platforms. Using XML markup, it’s just as easy to define the shape of a heart in as it is to define the structure of a SQL database table.
Now that you have a handle on XML, let’s talk about the type of XML markup that allows us to draw pictures! SVG is an XML-based markup language for describing two-dimensional based vector graphics. It is an open Web standard for describing images that can be rendered cleanly at any size and are designed specifically to work well with other web standards including CSS, DOM, JavaScript, and SMIL.
“SVG is, essentially, to graphics what HTML is to text.” (A quote from the mozilla.org website, from which this article borrows heavily)
The current version of SVG is SVG1.1. SVG 2 reached the Candidate Recommendation stage on 15 September 2016. The latest draft was released on 08 March 2023. This version of SVG builds upon SVG 1.1 Second Edition by improving the usability of the language and by adding commonly requested features.
SVG can be integrated with HTML either by using SVG in HTML or by using HTML in SVG, in both cases either by inclusion or reference.
Sophisticated applications of SVG are possible by use of a supplemental scripting language which accesses SVG Document Object Model (DOM), which provides complete access to all elements, attributes and properties. A rich set of event handlers can be assigned to any SVG graphical object. Within a web page, the same scripts can work on both HTML and SVG elements.
SVG is useful for rich graphical presentation of information, including a number of accessibility features that, used correctly, ensure the content can be used by the widest possible audience.
Your SVG Canvas
Understanding the viewport is crucial for positioning elements accurately and ensuring proper content visibility within the SVG window. So what is it? The SVG viewport defines the rectangular area in user space (abstract units) that serves as the drawing area for the SVG content. It acts like a canvas or frame within which all the shapes, paths, text, and other elements are positioned and rendered. While not directly related to the physical canvas (screen or display), it establishes a cartesian coordinate system and dimensions for the SVG itself.
For example, a viewport defined with viewBox=”0 0 100 50″ creates a drawing area starting at (0, 0) with a width of 100 units and a height of 50 units. An element outside the viewport won’t be visible, similar to content outside the visible area of a window.
And herein lies the secret to vector graphics — the SVG viewport. It is your canvas — a designated area within the graphic itself. When displayed, the viewport adjusts the attributes of an element dynamically to the available space on the user’s device, whether it’s a tiny smartphone screen or a colossal billboard. So, no matter how someone views your SVG, they’ll always experience the same crisp, razor-sharp visuals.
Math!
Most probably fell by the wayside as soon as I mentioned Cartesian coordinate system, so thanks for sticking with me so far! You don’t have to be an Einstein to understand the math here. (And thank goodness for that else I’d be lost!). While knowing some basic math can definitely help when working with SVGs, it’s not absolutely required when drawing simple shapes like lines, rectangles, and circles within the specified window (viewport). However, understanding “maths” becomes more important as you:
- Position elements precisely: If you want elements to be located at specific coordinates within the viewport, knowing coordinates and basic operations like addition, subtraction, and multiplication comes in handy.
- Create complex shapes: Using paths in SVG requires defining coordinates for control points, which rely on understanding relative or absolute positioning based on the viewport dimensions.
- Adapt SVGs to different viewports: When making your SVG responsive or ensuring it looks good on various screen sizes, understanding percentages and ratios becomes helpful for scaling and adapting elements within the viewport.
- Perform calculations and transformations: And yes, it’s true! If you want to rotate, scale, or translate elements based on certain values or calculations, basic math knowledge becomes necessary.
Let’s Draw!
SVG Elements & Attributes
There are a variety of basic SVG shapes, aka elements. An SVG element is a building block for creating scalable vector graphics, defined by XML tags and attributes to shape, color, and animate visual elements on a web page. A SVG attribute is a specific characteristic assigned to an element, detailing its appearance, behavior, or animation within the scalable vector graphic.
In essence, combining SVG elements and attributes is like writing instructions for your drawing tools. You tell them what to draw, how to draw it, and how it should behave, resulting in rich and interactive vector graphics that add depth and expressiveness to your web projects.
6 Basic Shapes and a Squiggly Line
The shortest distance between two points is a straight line. In SVG, drawing a straight line is accomplished using the <line> element. It is specifically designed to draw straight lines in SVG. It leverages the familiar Cartesian coordinate system (x, y) to pinpoint the exact locations of the start and end points. You simply specify the starting values (x1 and y1), and the ending values (x2 and y2).
For example, the following SVG code draws a vertical red line:
<line x1="0" y1="80" x2="100" y2="20" stroke="red" />Breaking down the entire line of SVG markup:
Attributes: The <line> element has four primary attributes defining a line’s characteristics:
x1=”0″ and y1=”80″: These define the coordinates of the starting point of the line. (0, 80) represents a position 0 units horizontally (along the x-axis) and 80 units vertically (along the y-axis) from the top-left corner of the SVG canvas.
x2=”0″ and y2=”20″: These define the coordinates of the ending point of the line. It remains at the same horizontal position (0) but moves down to 20 units vertically, creating a vertical line.
stroke=”red”: This attribute specifies the color of the line. In this case, it’s set to “red”. If you are following along and running your own tests, feel free to use any other valid color name or hex color code. #C0FFEE is a personal favorite.
Circle
Much like <line>, the SVG <circle> element has its own defining attributes. Or, more accurately, it has its own attributes that, when combined, define a circle. For example:
<circle cx="50" cy="50" r="50" /><circle> attributes include:
- cx (the x-axis coordinate of the center of the circle),
- cy (the he y-axis coordinate of the center of the circle), and
- r (radius)
One additional attribute to mention – pathLength is a Geometry Property. pathLength is an optional attribute for all the shape constructs that I’ll cover today, but Geometry Properties is a topic that we’ll cover in a future installment.
Ellipse
Much like the SVG circle, the starting position of the SVG ellipse is defined in cx and cy. Because an ellipse can be taller than it is wide (or vice versa, i.e. elongated), it has two foci (and two radii too, but that’s beside the point … groan … ). Point being, the additional positional data for a SVG ellipse is defined in rx and ry. For example:
<ellipse cx="100" cy="50" rx="100" ry="50" />- cx (The x position of the center of the ellipse)
- cy (The y position of the center of the ellipse)
- rx (The radius of the ellipse on the x axis)
- ry (The radius of the ellipse on the y axis)
Rectangle
The rectangle <rect> has to be the most-used SVG shape in existence. Used in everything from borders & buttons to zippers and zigzags, rectangles are more than common in graphic design. So they should be easy to define. In fact:
<rect width="200" height="100" />… is enough SVG markup to draw a simple rectangle. Additional attributes allow finer control over the rectangle’s starting position and corner radii.
Summarizing attributes of an SVG rectangle:
- x (The x coordinate of the rect. Value type: <length>|<percentage>)
- y (The y coordinate of the rect. Value type: <length>|<percentage>)
- width (the width of the rectangle)
- height (the height of the rectangle)
- rx (The horizontal corner radius of the rect)
- ry (The vertical corner radius of the rect)
To draw a square, set both width and height to the same numeric value.
Polygon
Draw closed shapes with straight lines using the <polygon> element. Each line connects to the next, forming a loop. Imagine a fence built with straight panels – that’s what the <polygon> element does in SVG. Each panel connects to the next, and the last one closes the shape like a chain linking back to the first.
<polygon points="0,100 50,25 50,75 100,0" />As you can see, we’re now being introduced to the concept of defining a stream of points (pairs of x,y coordinates) in our element. Rather than a single x,y coordinate that defines the center of a perfect circle, or the height/width attributes of the rectangle element, we are now defining many different unique points, where each point is both the beginning coordinate of a new line, and the ending coordinate of the last one.
Polyline
Much the same as a polygon except a polyline doesn’t have to be a closed shape. Unlike a polygon, a polyline’s last point doesn’t have to be connected to its first point.
<polyline points="0,100 50,25 50,75 100,0" />Path
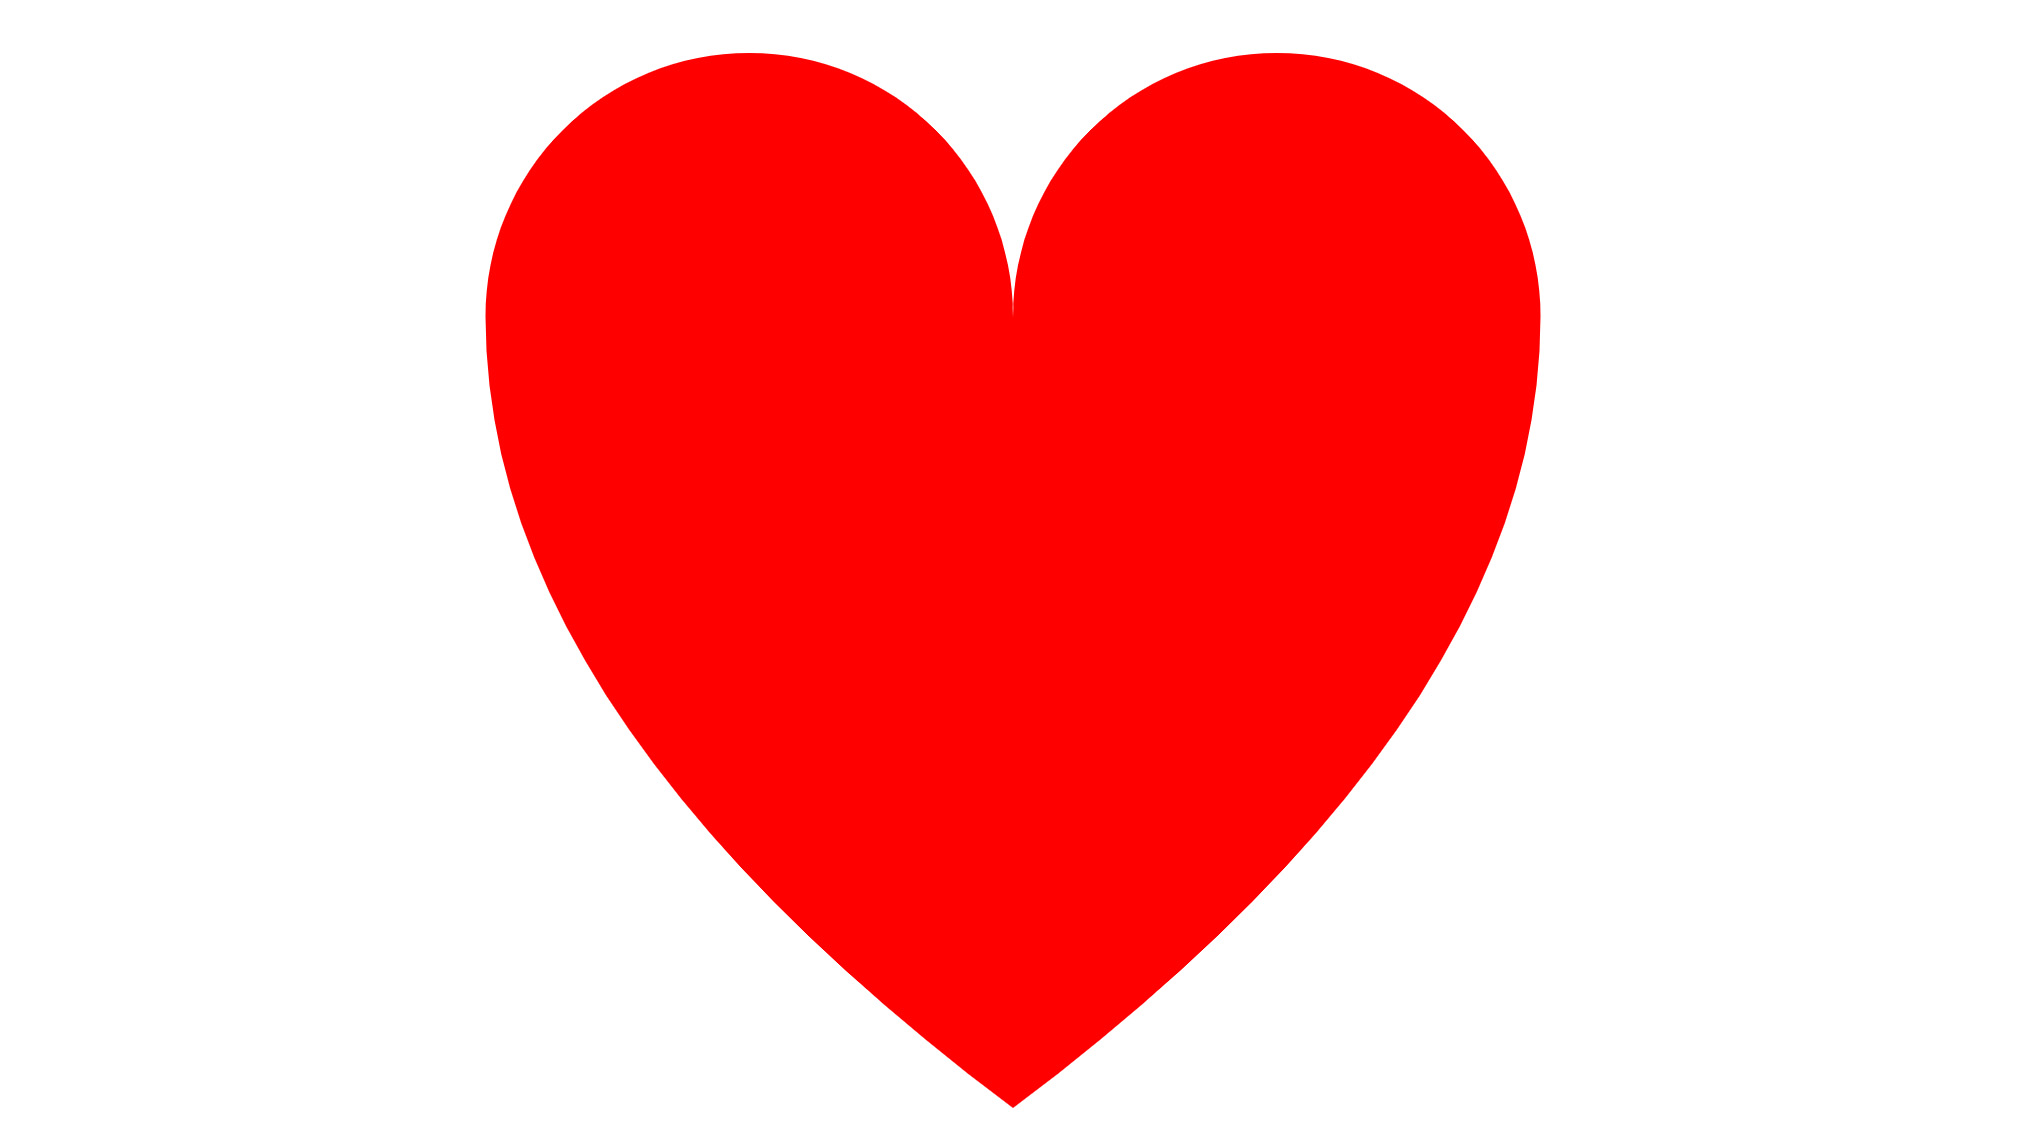
The final “shape” that we’ll cover today is the path. Path is a generic element that is used to define a shape. Any shape. Including rectangles, circles, and even squiggly lines! In a way it is a more advanced construct than any of the shapes that we’ve covered so far, but if you’ve followed along, its structure should be easy to understand. The following shape (a heart) is most appropriate for today (Feb 14, 2024).
<path
d="M 10,30
           A 20,20 0,0,1 50,30
           A 20,20 0,0,1 90,30
           Q 90,60 50,90
           Q 10,60 10,30 z"
fill = “red” />
Keen eyes will notice the similarities of the path statement to other shape elements, specifically the use of paired coordinates. But what does the ‘d’ do? And what do the letters M, A & Q do? Does this command secretly identify as a modified question and answer element? Let the conspiracy theories fly!
In the meantime, this is what those letters actually mean:
‘d’ is a presentation attribute. That’s all you need to know. Skip to the next section. Or read the next several paragraphs. The choice is yours.
Presentation attributes are a specific type of attribute used to define the visual appearance and behavior of elements within your vector graphic. They offer a straightforward way to style elements, working alongside CSS for more advanced styling options.
‘d’ plays a unique role compared to some other presentation attributes. Here’s why:
- Defines the path data for <path> elements in SVG, essentially drawing the shape and outline of paths using various commands like M (move), L (line), C (quadratic curve), etc.
- While it influences the visual appearance of the path, it also defines the shape itself, going beyond a purely stylistic role.
Presentation attribute aspects:
- Directly attached to the <path> element.
- Offers a way to modify the path’s appearance through path commands (similar to how other presentation attributes like fill or stroke affect visual aspects).
Unique aspects:
- Unlike most presentation attributes that solely affect appearance, ‘d’ directly defines the geometric shape of the path.
- It’s essential for creating any complex shapes beyond basic shapes like circles or rectangles.
The Next Section – M, A, & Q
To cover the remainder of the path element quickly, M, A, Q are path commands:
- A – draws an Arc curve from the current point to the coordinate x, y (The center of the ellipse used to draw the arc is determined automatically based on the other parameters of the command)
- Q – draws a quadratic Bezier curve from the current point to the end point specified by x, y. The control point is specified by x1, y1. Any subsequent pair(s) of coordinate pairs are interpreted as parameter(s) for implicit absolute quadratic Bezier curve (Q) command(s).
But wait, there’s more! We aren’t going to cover them in any detail in this installment, but there are currently 6 types of paths for a total of 20 (case-sensitive) path commands:
- MoveTo: M, m
- LineTo: L, l, H, h, V, v
- Cubic Bezier Curve: C, c, S, s
- Quadratic Bezier Curve: Q, q, T, t
- Elliptical Arc Curve: A, a
- ClosePath: Z, z
What’s next?
This article barely scratches the surface of vector graphics but should help to begin to demystify vector graphics and vector graphic development using SVG markup language. The primary takeaways from this article are understanding the viewport, its importance, and knowing that many basic shapes can be created in quick fashion using straightforward / readable / mostly understandable SVG markup. In a future installment we’ll look a little closer at M, A, Q, and the 16 other path commands.
Sources & References: developer.mozilla.org, en.wikipedia.org